
《干性年龄相关性黄斑变性中蓝眼底自发荧光与 SD-OCT 测量的地理萎缩之间的相关性》
Correlation Between Blue Fundus Autofluorescence and SD-OCT Measurements of Geographic Atrophy in Dry Age-Related Macular Degeneration
To compare fundus autofluorescence (FAF) and spectral domain optical coherence tomography (OCT) measurements of geographic atrophy (GA) area and to analyze lesion area changes measured by spectral domain OCT in GATHER1.
比较采用眼底自发荧光(FAF)与谱域
An assessment reliability analysis using prospective, randomized, double-masked phase 2/3 clinical trial data.
一项采用前瞻性、随机、双盲2/3期临床试验数据的评估可靠性分析。
方法 /Methods
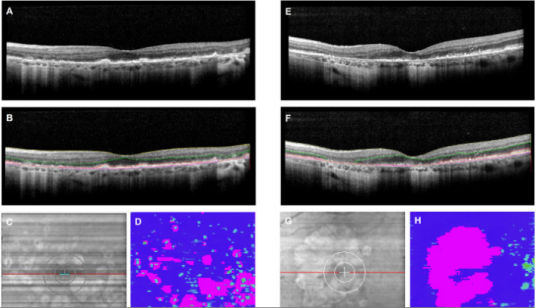
GATHER1 examined the efficacy and safety of avacincaptad pegol (ACP) for GA treatment. A post hoc analysis was performed to identify correlations between FAF- and OCT-based measurements of GA. GA area was measured on blue-light FAF images using semiautomatic segmentation software with support from OCT and near-infrared imaging. Machine-learning enhanced, multilayer segmentation of OCT scans were reviewed by human readers, and segmentation errors were corrected as needed. GA area was defined as total RPE loss on cross-sectional B scans. Time points included Months 0, 6, 12, and 18. Additionally, OCT-based GA-area changes between ACP and sham were analyzed.
GATHER1研究评估了avacincaptad pegol(ACP)治疗GA的有效性和安全性。进行事后分析以确定基于FAF与OCT的GA测量值相关性。在蓝光FAF图像上采用半自动分割软件测量GA面积,并结合OCT及近红外成像进行辅助确认。人工阅片者对经机器学习增强的多层OCT扫描分割结果进行审查,并在必要时对分割误差进行修正。GA面积定义为横断面B扫描中的总RPE缺失面积。评估时间点包括第0、6、12和18个月。此外,还分析了ACP组与假手术组之间基于OCT的GA面积变化。
结果 / Results
There was a strong correlation (r = 0.93) between FAF and OCT GA area measurements that persisted through 18 months. Mean (SD) differences between OCT and FAF GA measurements were negligible: 0.11 mm2 (1.42) at Month 0, 0.03 mm2 (1.62) at Month 6, -0.17 mm2 (1.81) at Month 12, and -0.07 mm2 (1.78) at Month 18. OCT assessments of GA growth revealed a 30% and 27% reduction at Months 12 and 18, respectively, between ACP and sham, replicating FAF measurements from GATHER1.
FAF与OCT测得的GA面积在18个月内显示出高度相关性(r = 0.93)。OCT与FAF测得的GA均值(SD)差异可忽略不计:第0月为0.11 mm2(1.42),第6月为0.03 mm2(1.62),第12月为-0.17 mm2(1.81),第18月为-0.07 mm2(1.78)。OCT评估显示,ACP组与假手术组在第12个月和第18个月的GA增长率分别降低30%和27%,与GATHER1研究中FAF测量结果一致。
结论 / Conclusion
The strong correlation between blue FAF and OCT measurements of GA area supports OCT as a reliable method to measure GA lesion area in clinical trials.
蓝光FAF与OCT测得的GA面积存在高度相关性,证实了OCT是临床试验中测量GA病灶面积的可靠方法。
来源:https://pubmed.ncbi.nlm.nih.gov/38719131
医脉通是专业的在线医生平台,“感知世界医学
本平台旨在为医疗卫生专业人士传递更多医学信息。本平台发布的内容,不能以任何方式取代专业的医疗指导,也不应被视为诊疗建议。如该等信息被用于了解医学信息以外的目的,本平台不承担相关责任。本平台对发布的内容,并不代表同意其描述和观点。若涉及版权问题,烦请权利人与我们联系,我们将尽快处理。

 我要投稿
我要投稿


